

Public content served from the new content model and resolved through migrated aliases.
Before diving into how to perform vibration analysis on Kaplan Turbines, we should learn some important details about this type of hydraulic turbine and its components.
This hydraulic turbine is named after its inventor, Austrian engineer Viktor Kaplan.
It is one of the different turbines used worldwide to take advantage of hydraulic energy to generate electric power. In other words, the kinetic energy provided by the flow of water is transformed into mechanical energy to move a generator that will transform that mechanical energy into electric energy.
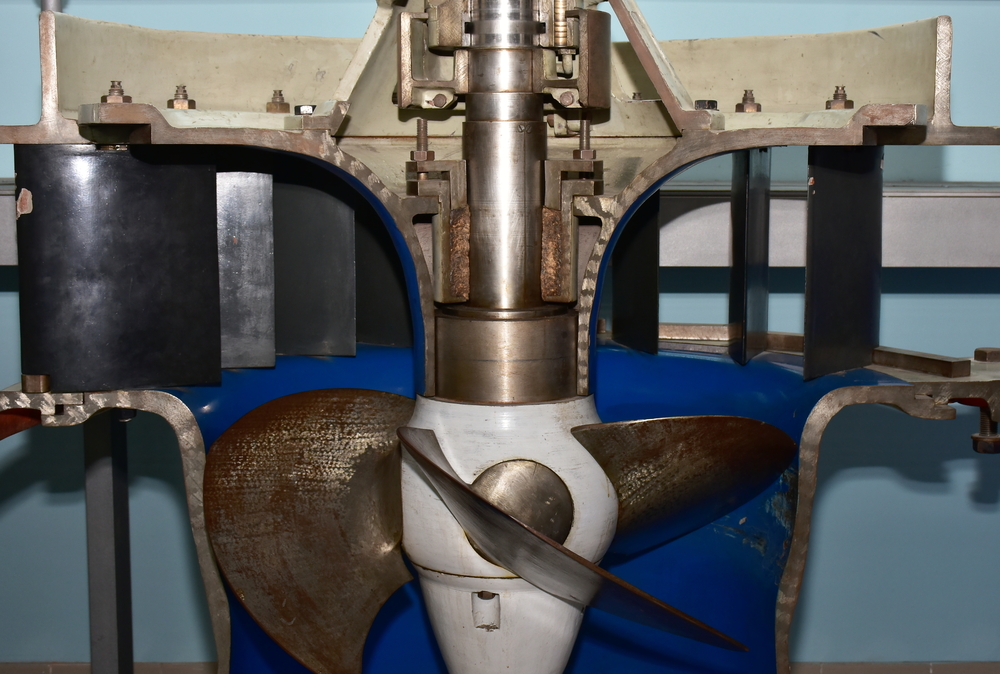
It is described as a reaction turbine with axial flow, which can be very efficient and capable of using level drops of as little as 2 meters and large flows from 200 to 300 cubic meters.
The main components of a Kaplan turbine are:
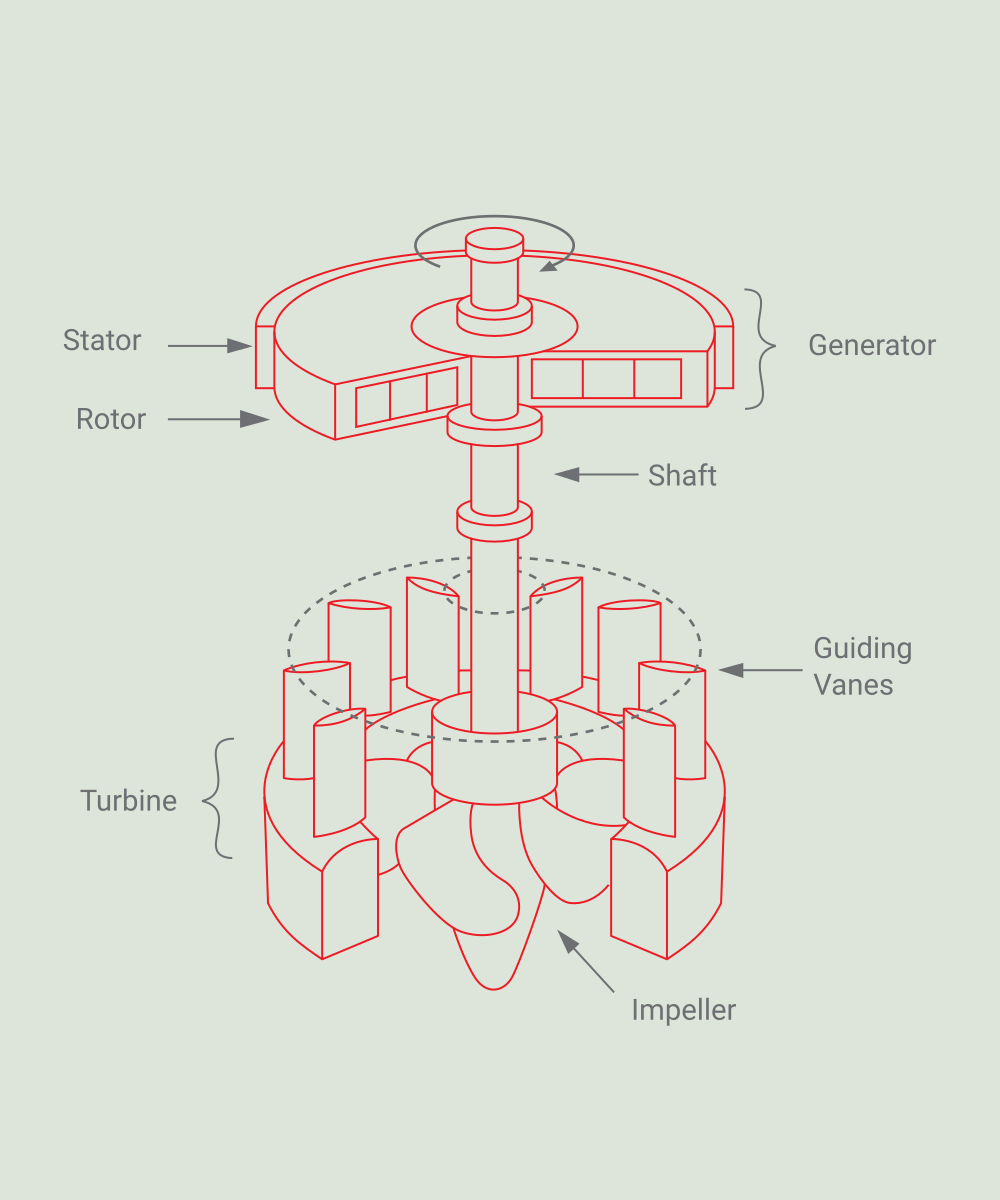
Unlike propeller turbines, which usually work for a determined flow, Kaplan turbines can be adapted to the current flow thanks to their adjustable blades. Therefore, these turbines are very efficient, reaching up to 90% efficiency in a wide range of flows.
There is a group of hydraulic turbines that are considered variations of the Kaplan turbine, including:
As with any other type of analysis, measuring vibrations on Kaplan turbines will depend on the turbine's specific case and monitored conditions.
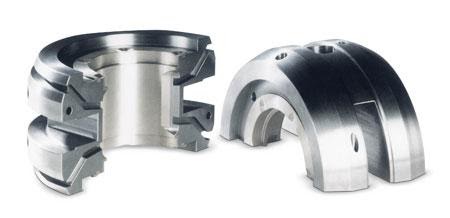
Also, it is important to highlight that most hydraulic turbines use Babbitt bearings to support the shaft. They are generally installed in a vertical position, so vibration analysis requires a different approach from the one used while performing electric motors' vibration analysis.
However, some general aspects must be considered while performing vibration analysis on any Kaplan turbine. For example:
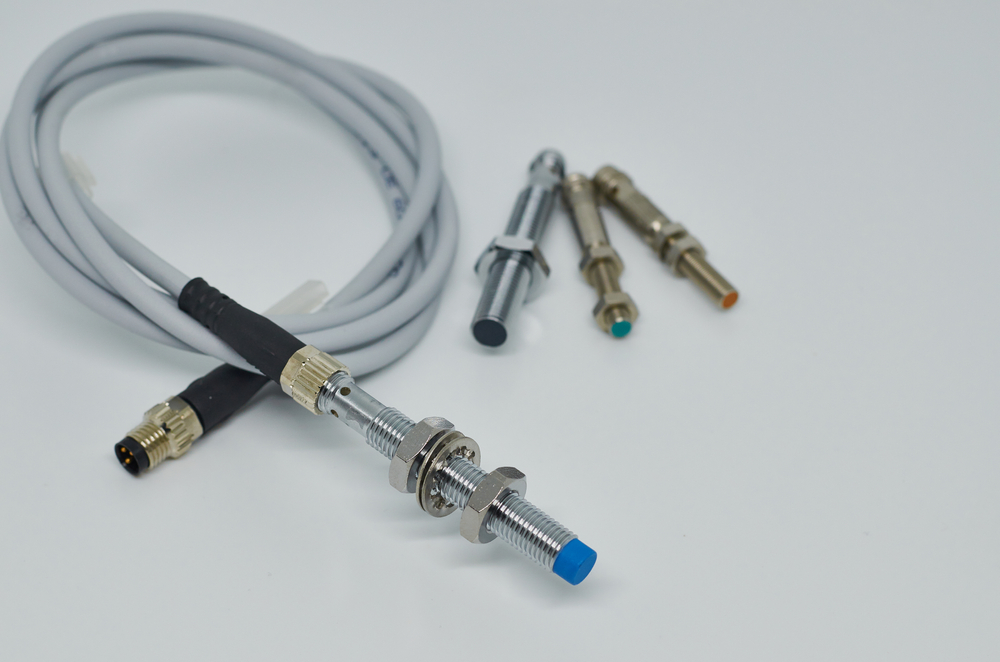
Using proximity sensors to measure displacement on Kaplan turbines makes sense only if Babbitt bearings support the shaft. This is related to the fact that the shaft is submerged in an oil film, and it can pivot (move relative to the bearing).
Two proximity sensors are usually placed (X,Y) to generate a graphic of the orbit's quality generated by the shaft inside the bearing. When the turbine is in a horizontal position, the sensors are placed at 45° with the horizontal line to make it easy to perform maintenance on the two-part bearings.
 In the case of having the shaft supported by roller bearings, the frequencies that usually provide valuable information on possible failures are in the high ranges of frequencies, with values above 100Hz. Vibrations with an amplitude out of normal values at these frequencies usually indicate bearing problems.
To diagnose possible failures on Kaplan turbines using vibration analysis, data must be collected along time to obtain the trends on the different transient operation conditions:
It is important to keep in mind that, when comparing trends, transient conditions usually provide the most relevant information.
When carrying out the analysis with trend graphics, it is important to know which are the vibration ranges that are considered as acceptable values, alarm values and emergency values. These can be easily determined by applying the ISO 7919-5 : 2005 norm for PK-PK vibration ranges by only knowing the rotation speed of the machine.
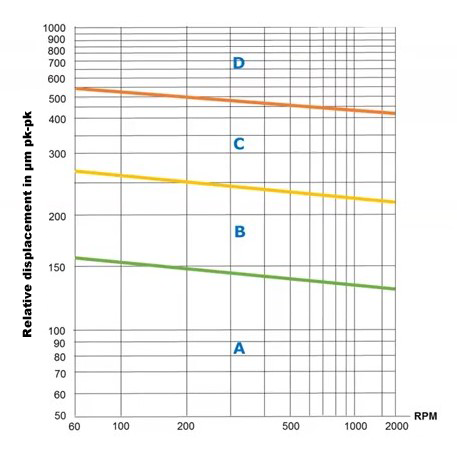
Before determining any condition, all the different stable and transient conditions graphics obtained during the data collection must be analyzed.
Recommendation
When an undesired condition is identified at a specific load while studying the trend graphics, it is recommended to avoid operating the machine at such load.
 Imbalance
It is important to highlight that imbalance in these machines can happen due to mass imbalance or magnetic imbalance.
To diagnose a possible imbalance, the wave obtained by the proximity sensor must be studied together with the phase and identify abnormal vibration values at 1x. When these values are found while analyzing the machine without load, it can be concluded that the problem is a mass imbalance.
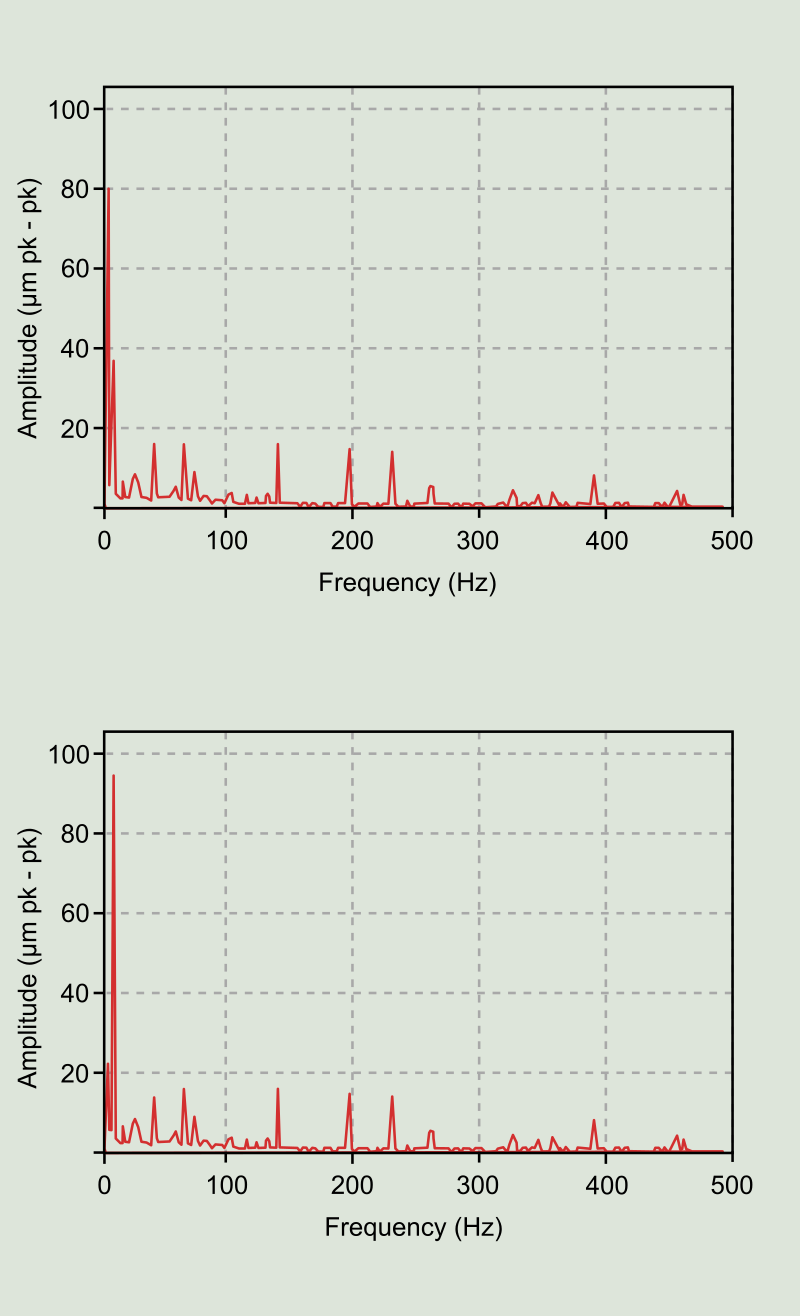
On the other hand, a magnetic imbalance can be diagnosed when the peak at the rotor's speed increases at the same time the energy starts being generated. For this study, it is necessary to use complements for the vibration sensors, such as the magnetic flow and air gap complements installed on the rotor and the stator of the machine.
When the trend graphic shows values above the alarm values when the exciter starts working at a minimum load, the imbalance may happen due to an electric decompensation in the machine. This can result from problems (irregularities) in the air gap, geometry problems in the stator or a short circuit between coils.
Recommended actions:
Cuando se presentan niveles de desbalanceo altos se recomienda planificar una parada para realizar el balanceo de la máquina. When high levels of imbalance are identified, it is recommended to plan a shutdown to carry out the proper balancing of the machine.
 Misalignment
Misalignment can be identified when two proximity sensors installed on the same shaft before the coupling device show discrepancy.
Trend graphics can also indicate possible misalignment when analyzing the vibration levels during a shutdown. This can be observed when the speed is reduced to the range of 80 – 100 RPM (before reaching zero), and the levels of vibration stay high without any change.
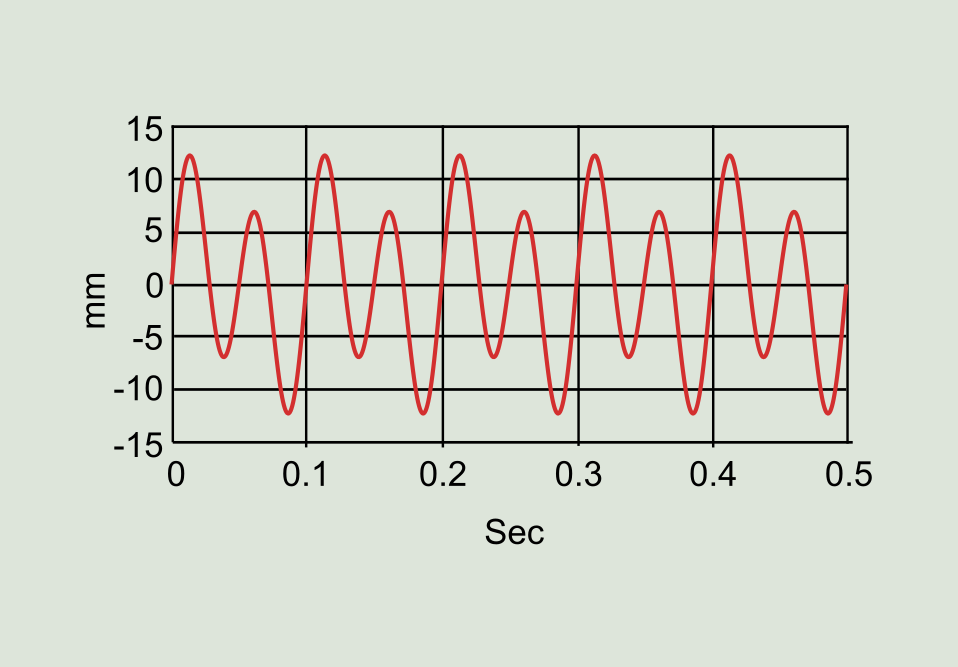
If the wave shape is similar to an M, with peaks at 2x (axially) or two cycles per rotation, a possible angular misalignment can be considered.
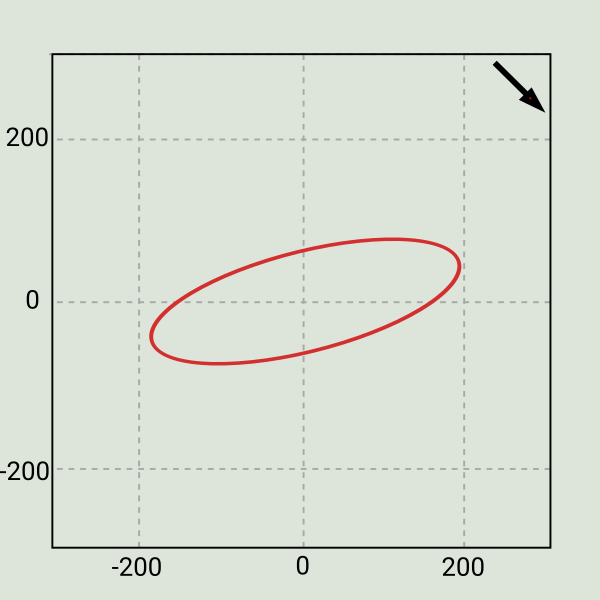
With the DC signal of the proximity sensors, it is possible to analyze the shaft center's graphic. This graphic allows identifying possible misalignment issues. When combined with phase graphics and orbit graphics, it is possible to identify the type of misalignment present.
Recommended actions:
If the orbit graphic looks like a number 8, the misalignment is severe, and it is recommended to shut down the machine immediately to carry out the corresponding alignment.
 Bent shaft
As it happens with misalignment, the possibility of a bent shaft can be observed when analyzing the trend graphics during a shutdown.
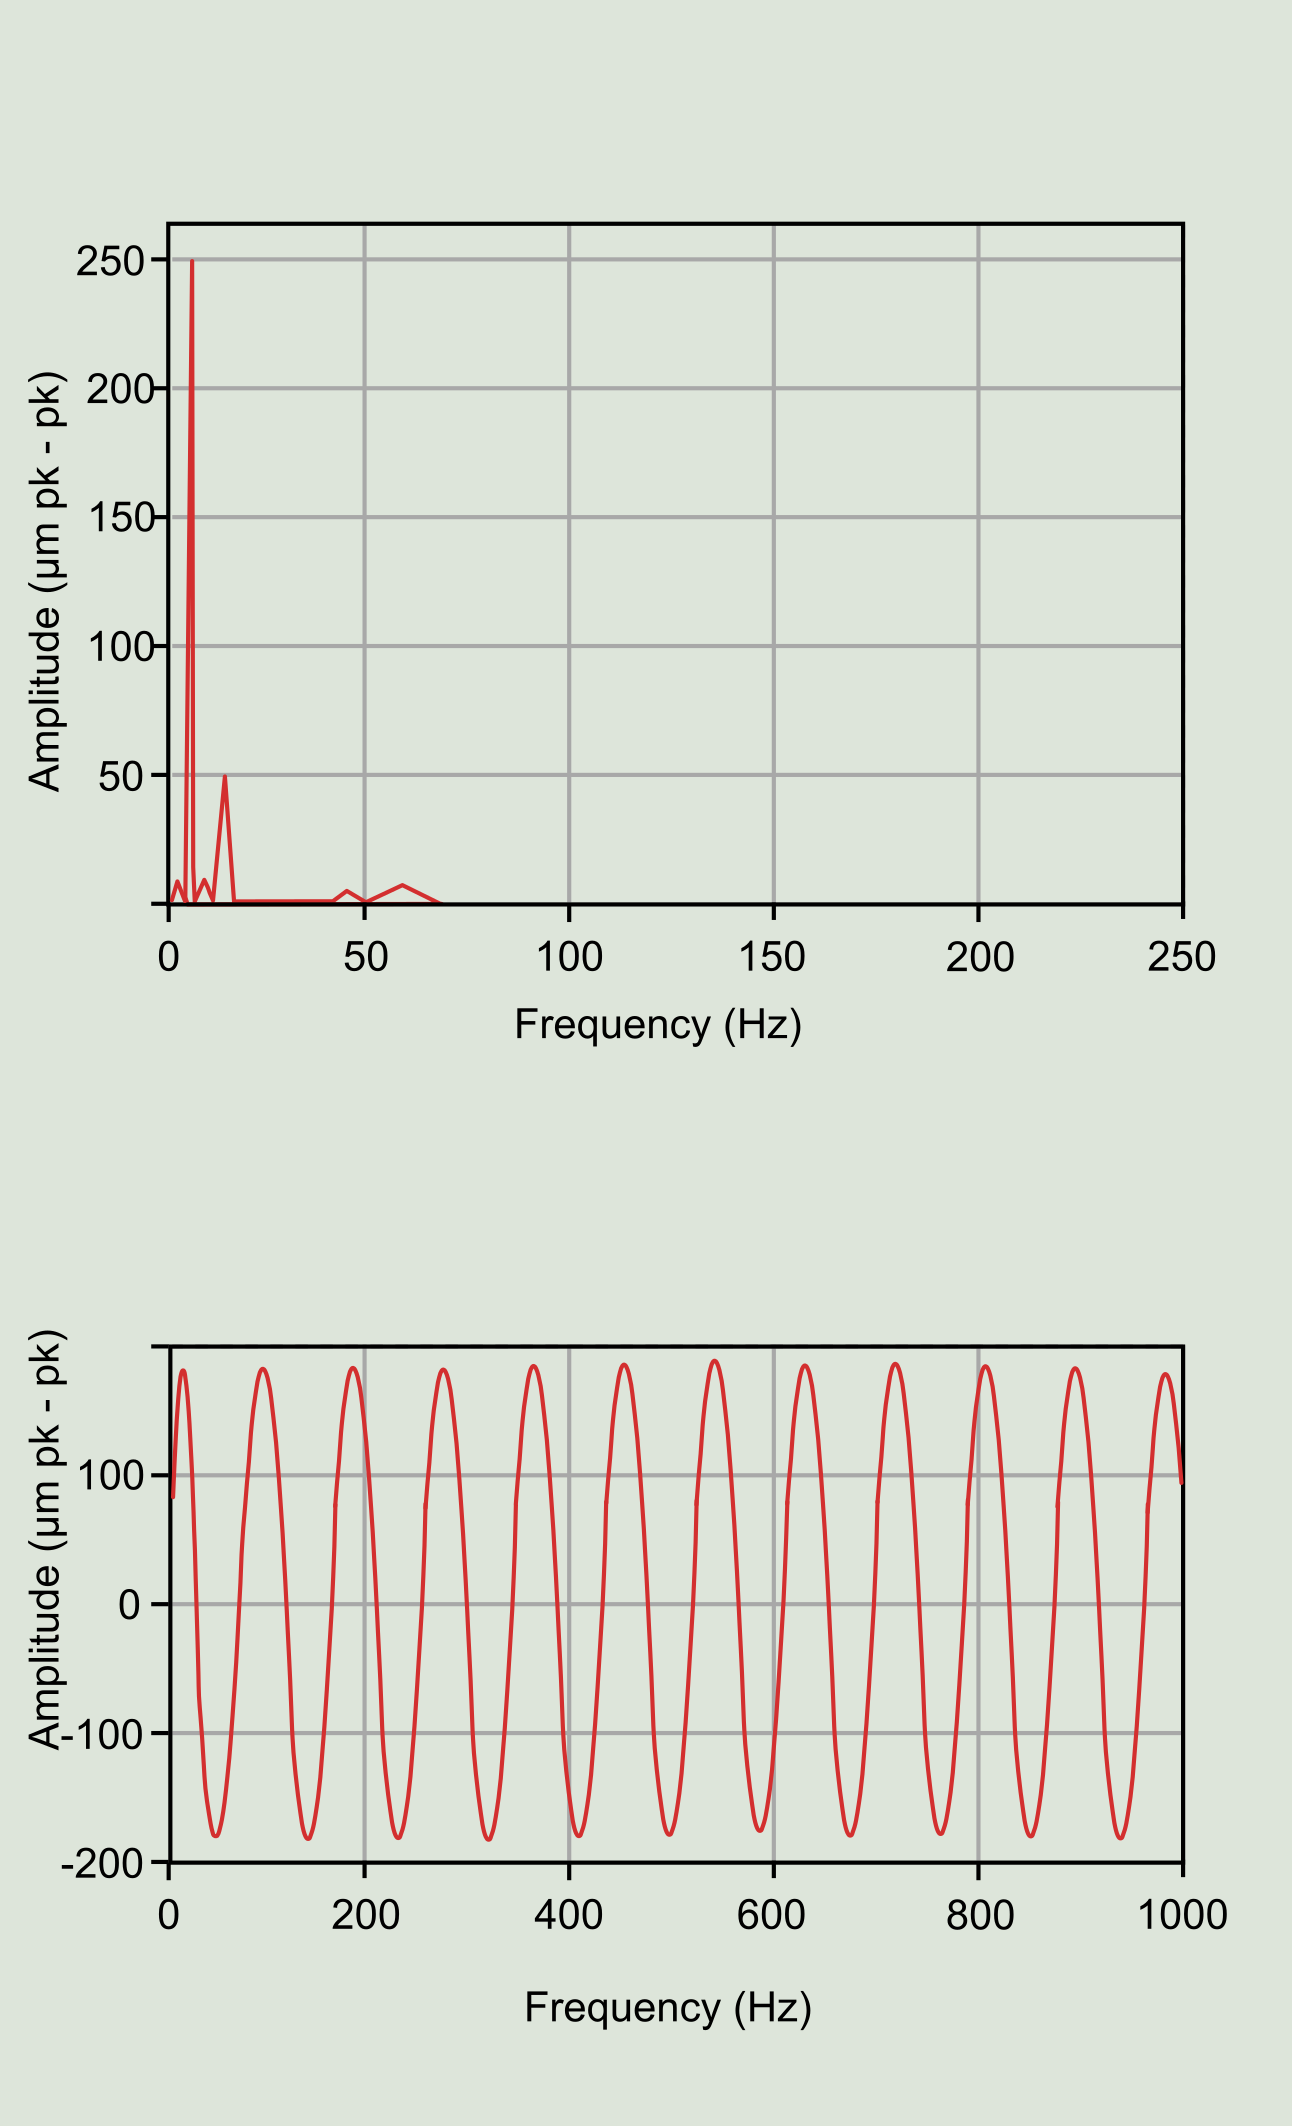
The wave closer to a sinusoidal one at 1x (radially) with high levels of vibration indicates a bent or misaligned shaft. Again, the phase must be analyzed in this case.
Bent shaft issues in these machines are usually noticed during start up, when the turbine is operating at low speeds.
Recommended actions:
After some time in operation, the shaft might go back to its natural geometry due to thermal variations.
If this is not the case, it is recommended to stop the machine and perform any required corrective action, such as heat treatment, machining or shaft replacement.
 Looseness and structural problems
To diagnose structural issues, it is necessary to use the data collected with accelerometers. When high harmonic vibration levels (1x, 2x, 3x…) are found radially, structural looseness can be diagnosed.
Recommended actions:
Since these turbines do not rotate at high speeds when compared to electric motors and other machinery, if the accelerometers measure high vibration values, it indicates that the problems are severe. It is recommended to immediately shut down the machine to perform the corresponding corrective actions.
 Rub
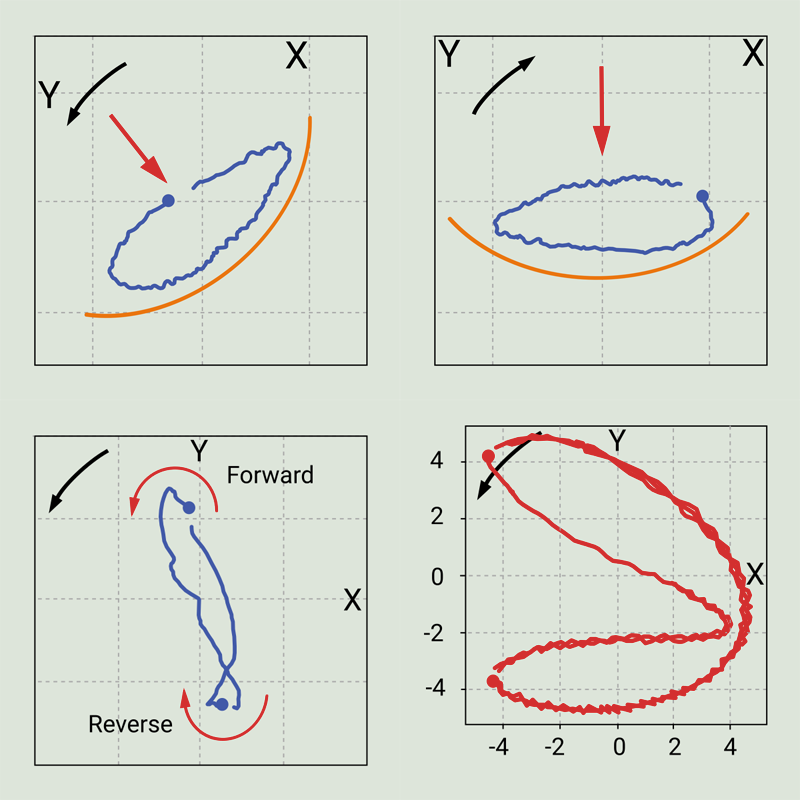
RubWhen analyzing the orbit graphic, if the shaft's precession movement is registered opposite to the rotation movement of it, it can be concluded that there are significant rubbing issues.
The shape of the orbit allows the identification of abnormal preloads and rubs.
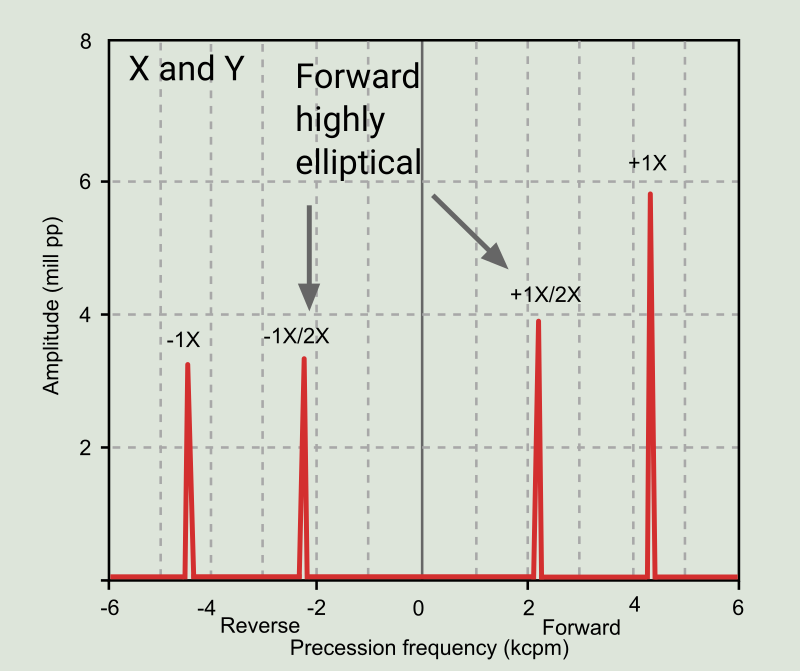
Another helpful graphic to determine the presence of rub is the full spectrum. In this case, significant peaks are observed at minus 1x and minus 1/2x.
Recommended actions:
During a planned shutdown, study the possible causes of the abnormal preloads that result in a severe rub.
 Blade issues
Due to these turbines' nature of the operation, it is recommended to install accelerometers on the suction pipe.
At high Gs, the spectrum with multiple peaks on the suction pipe may indicate cavitation. Evidence of possible cavitation can also be observed in the spectrum at 0.3x.
Recommended actions:
These problems are usually fixed by adjusting the angle of the blades to achieve the desired flow.
Condition monitoring on Kaplan turbines must not be only centered on vibration analysis. Other predictive maintenance technologies used are:
Sources:
http://www.ghiggia.it/
https://solar-energia.net/
https://a-maq.com/