

Public content served from the new content model and resolved through migrated aliases.
In today's industrial landscape, efficiency and reliability are critical. Unplanned downtimes and equipment failures lead to financial losses, production disruptions, and safety issues. Condition-Based Maintenance (CBM) has become a key strategy to ensure asset reliability and longevity, with the P-F Curve playing a central role. This conceptual tool represents the progression of asset degradation from the initial point of potential failure to complete functional failure.
This blog post is part of a series of academic articles on Condition-Based Maintenance. The P-F Curve concept is particularly important for maintenance managers, plant managers, reliability engineers, and industrial engineers who aim to keep assets performing at their best. In this post, we explore the origins of the P-F Curve, its practical application using an example of bearing failure, and its impact on maintenance strategies. We also highlight the economic benefits of predictive maintenance and how the P-F Curve supports cost optimization.
Originally, maintenance strategies were reactive, addressing failures only after they occurred. This approach resulted in high costs and long downtimes. Preventive maintenance marked progress by implementing scheduled interventions, but it still lacked precision. The introduction of Reliability-Centered Maintenance (RCM), pioneered by experts like John Moubray, emphasized understanding failure modes and developing tailored maintenance strategies. Within this framework, the P-F Curve emerged as a key visual tool representing the condition deterioration process, enabling better prediction and preventing failures.
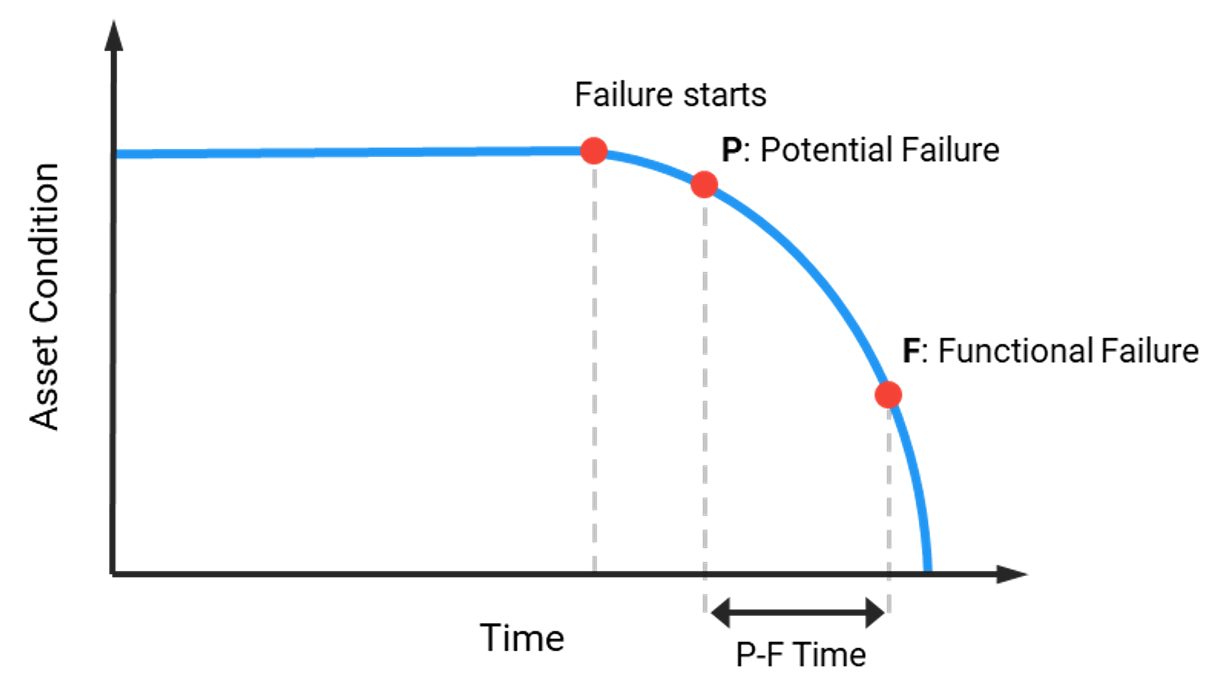
To understand the P-F Curve, let's consider a bearing in an industrial machine.
The P-F Interval is the time span between Points P and F, representing the window of opportunity for maintenance intervention. In the bearing example, early detection allows maintenance teams to repair or replace the bearing during scheduled downtimes, preventing unexpected shutdowns.
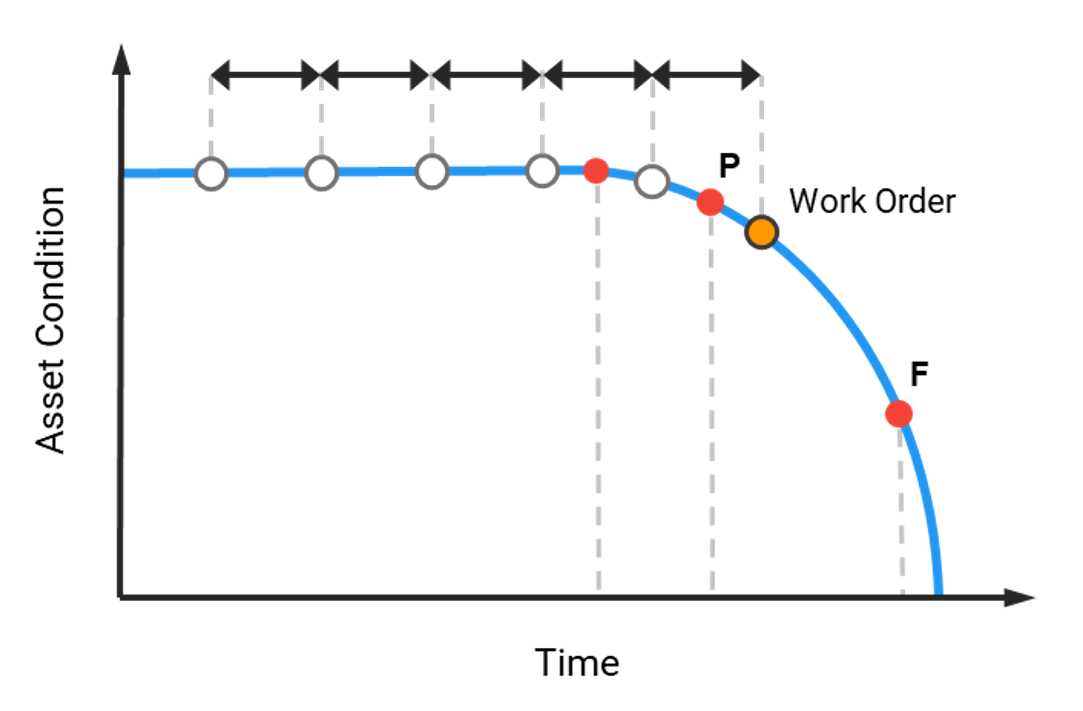
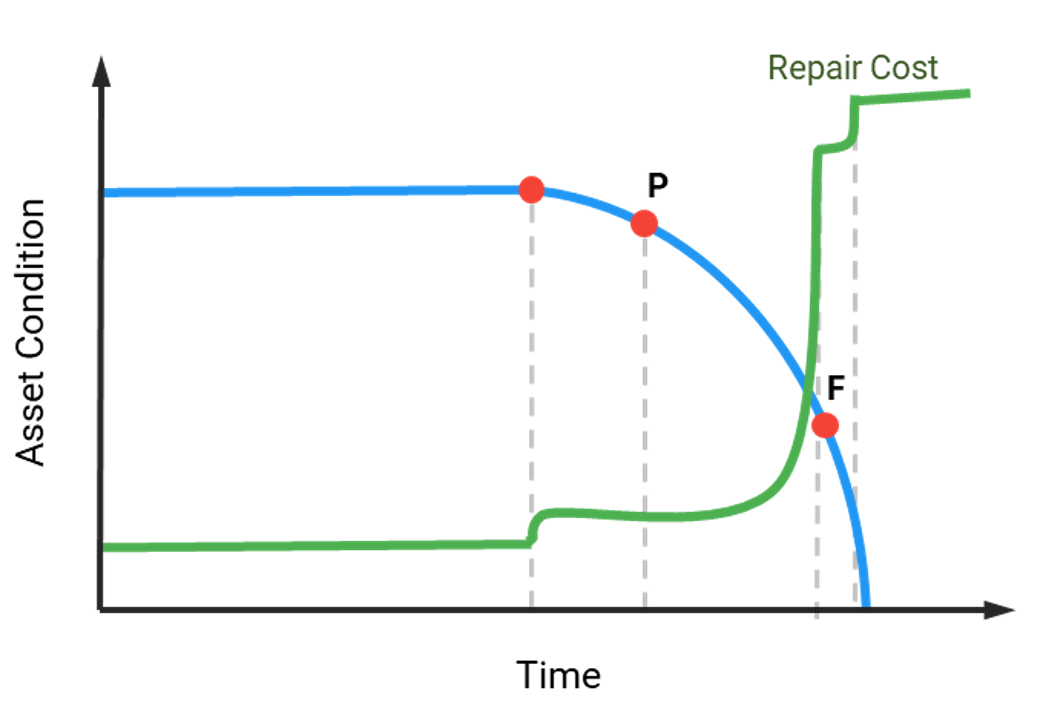
The P-F Curve emphasizes the importance of proactive maintenance strategies:
A common challenge in predictive maintenance is the disconnect between analysts and maintenance teams. To improve collaboration, analysts should provide clear, actionable recommendations and companies should use integrated systems that streamline the process of turning analysis reports into work orders.
The P-F Curve is a fundamental tool for predictive maintenance, enabling organizations to prevent failures, reduce costs, and improve asset reliability. By focusing on early intervention, optimizing inspection intervals, and leveraging technology, maintenance teams can enhance efficiency and contribute to a stronger bottom line.
To maximize the benefits of predictive maintenance, establish clear processes, enhance team communication, and focus on the economic impact of early interventions.
References
Moubray, J. (1997). Reliability-Centered Maintenance. Industrial Press Inc.
Smith, A. M., & Hinchcliffe, G. R. (2003). RCM: Gateway to World Class Maintenance. Elsevier.
Mobley, R. K. (2002). An Introduction to Predictive Maintenance. Butterworth-Heinemann.
Wienker, M., Henderson, K., & Volkerts, J. (2016). The Computerized Maintenance Management System: An Essential Tool for World Class Maintenance. Procedia Engineering, 138, 413-420.
Gupta, P., & Mishra, D. K. (2016). Predictive maintenance of industrial machines using IoT. International Journal of Computer Applications, 975, 8887.
Torres, C. E. "How to Calculate Condition-Based Maintenance Savings." Reliable Plant [online]. Available at: www.reliableplant.com/Read/31988/how-to-calculate-conditon-based-maintenance-savings, accessed October 29, 2024.